Google Analytics Basics (GA4)
- Valerie Hoy (Unlicensed)
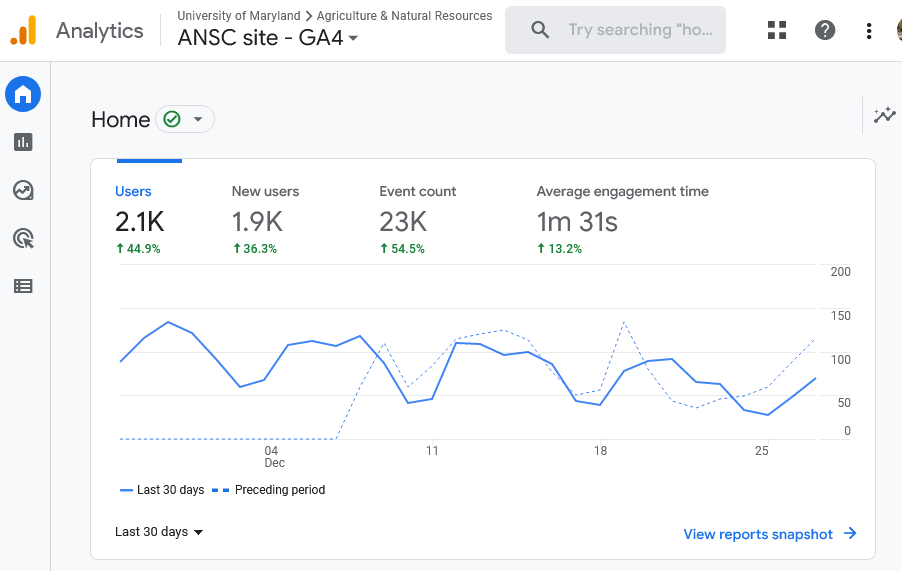
Visit analytics.google.com to view Analytics data.
When you first log in, you will see the Home screen with an overview of your last viewed property (In our case, "property" almost always means a single website). On this example screen, “ANSC site - GA4” is the property.
When you first log into Google Analytics (we'll call it GA for short!), it can be a little overwhelming. If you’re just getting started, try exploring the options below to get a feel for how GA works and the kinds of things you can learn from it.
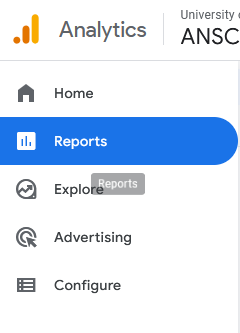
Reports
Google Analytics is a powerful tool that can provide a wealth of data about your website visitors. But the easiest way to use GA is to focus on Reports. Hover over the left sidebar to open it and click on Reports.
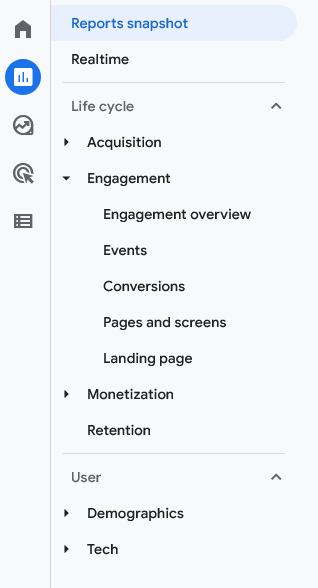
The left sidebar of the reporting interface shows a list of every report available.
If you click on any of the triangles to the left of the text, the menu will expand to show more options! This can seem like an endless array, but here's a quick summary of what they mean:
Life Cycle
The "Life Cycle" section is about the content on your site and how visitors interact with it.
- Acquisition – How people arrived at your site
- Engagement – What people are doing on your site. This is most people's favorite category, because it gives you visit counts and information about specific pages.
- Monetization – Shopping and advertising data (not something we have much use for at AGNR!)
- Retention - How long and how often people visit your site
User
The "User" section is about the the people who visit your site and the devices they use.
- Demographics – Characteristics of the people visiting your site
- Tech – Characteristics of the devices people use to visit your site.
Making sense of a report
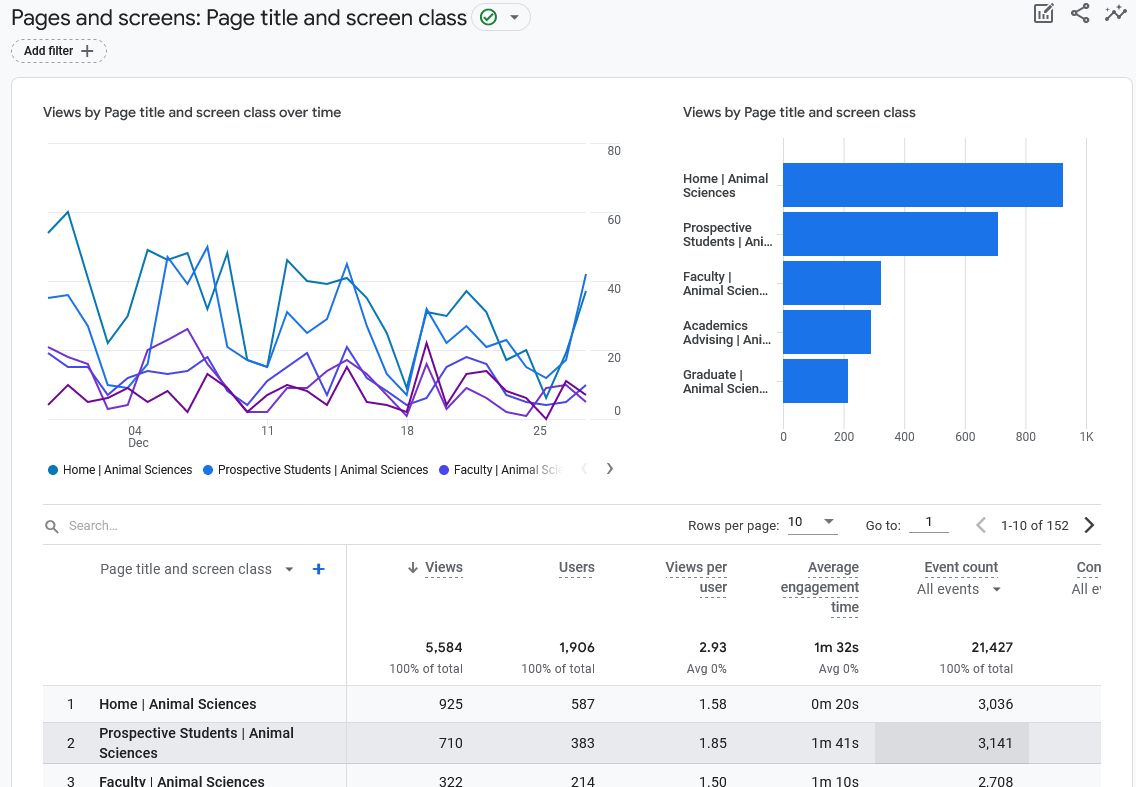
Almost every report you visit in Google Analytics will look similar to the one at right, consisting of three parts:
- A line graph showing how one or a few metrics have changed over time
- A bar chart comparing the total number a given metric for several dimensions
- A table showing a dimension and various metrics related to it.
What's a dimension? Well, in GA terms, it is a single "thing to keep track of."
In the example, the Primary Dimension is the title of a page. Each row in the table examines one page and reports on various metrics related to that page.
The top row (where no page URL is listed) shows a summary of all the pages on the site.
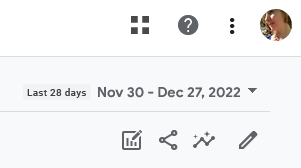
Your desired date range
No matter where you go in Google Analytics, you’ll want to make sure that you’re viewing statistics for the appropriate date range. I like to view a month of data. Sometimes a whole year is more appropriate. Rarely, you might want to just view a day or a week. Whatever you prefer, set it using the dropdown at the upper right of your screen.
The date settings you select will persist throughout Google Analytics until you change them again.